1. Quickstart
This is a very short guide on how to use ProLIF to generate an interaction fingerprint for a ligand-protein complex from an MD simulation.
Let’s start by importing MDAnalysis and ProLIF to read our input files:
[1]:
import MDAnalysis as mda
import prolif as plf
# load trajectory
u = mda.Universe(plf.datafiles.TOP, plf.datafiles.TRAJ)
# create selections for the ligand and protein
lig = u.atoms.select_atoms("resname LIG")
prot = u.atoms.select_atoms("protein")
lig, prot
[1]:
(<AtomGroup with 79 atoms>, <AtomGroup with 4988 atoms>)
MDAnalysis should automatically recognize the file type that you’re using from its extension. Click here to learn more about loading files with MDAnalysis, and here to learn more about their atom selection language.
Next, lets make sure that our ligand was correctly read by MDAnalysis.
⚠ This next step is crucial if you’re loading a structure from a file that doesn’t explicitely contain bond orders and formal charges, such as a PDB file or most MD trajectory files. MDAnalysis will infer those from the atoms connectivity, which requires all atoms including hydrogens to be present in the input file.
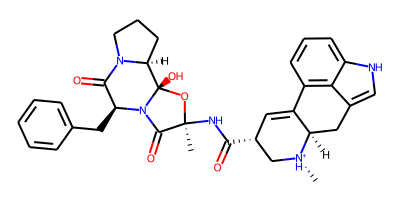
ProLIF molecules are built on top of RDKit and are compatible with its drawing code. Let’s have a quick look at our ligand:
[2]:
from rdkit import Chem
from rdkit.Chem import Draw
# create a molecule from the MDAnalysis selection
lmol = plf.Molecule.from_mda(lig)
# cleanup before drawing
mol = Chem.RemoveHs(lmol)
mol.RemoveAllConformers()
Draw.MolToImage(mol, size=(400,200))
[2]:
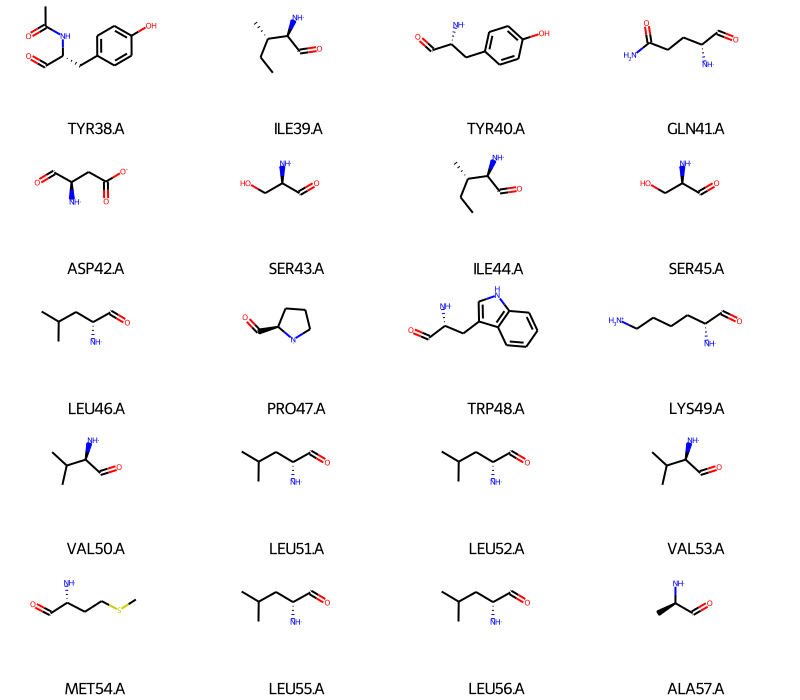
We can do the same for the residues in the protein (I’ll only show the first 20 to keep the notebook short):
[3]:
pmol = plf.Molecule.from_mda(prot)
frags = []
# to show all residues, simply use `for res in pmol:`
for i in range(20):
    res = pmol[i]
    mol = Chem.RemoveHs(res)
    mol.RemoveAllConformers()
    frags.append(mol)
Draw.MolsToGridImage(frags,
                     legends=[str(res.resid) for res in pmol],
                     subImgSize=(200, 140),
                     molsPerRow=4,
                     maxMols=prot.n_residues)
[3]:
guess_bonds=True when creating the Universe: u = mda.Universe("file.pdb", guess_bonds=True).In some cases, some atomic clashes may be incorrectly classified as bonds and will prevent the conversion of MDAnalysis molecules to RDKit, but workarounds exist:
Since MDAnalysis uses van der Waals radii for bond detection, one can modify the default radii that are used:
u = mda.Universe("file.pdb", guess_bonds=True, vdwradii={"H": 1.05, "O": 1.48})If you have separate PDB files for your ligand and protein, you can also directly use RDKit:
mol = Chem.MolFromPDBFile("prot.pdb", removeHs=False)
prot = plf.Molecule(mol)
mol = Chem.MolFromPDBFile("lig.pdb", removeHs=False)
lig = plf.Molecule(mol)
fp = plf.Fingerprint()
fp.run_from_iterable([lig], prot)
Everything looks good, we can now compute a fingerprint:
[4]:
# use default interactions
fp = plf.Fingerprint()
# run on a slice of frames from begining to end with a step of 10
fp.run(u.trajectory[::10], lig, prot)
[4]:
<prolif.fingerprint.Fingerprint: 8 interactions: ['Hydrophobic', 'HBDonor', 'HBAcceptor', 'Cationic', 'Anionic', 'PiCation', 'CationPi', 'PiStacking'] at 0x7f2e80e23460>
The run method will automatically select residues that are close to the ligand (6.0 Å) when computing the fingerprint. Alternatively, you can pass a list of residues like so:
fp.run(..., residues=["TYR38.A", "ASP129.A"])
Or simply use fp.run(..., residues="all") to use all residues in the prot selection.
The best way to access our results is to export our interaction fingerprints to a Pandas DataFrame. By default, the resulting DataFrame only keeps track of residues and interaction types that were seen in at least one of the frames in your trajectory. If needed, you can access the full results with fp.to_dataframe(drop_empty=False).
[5]:
df = fp.to_dataframe()
# show only the 10 first frames
df.head(10)
[5]:
| ligand | LIG1.G | ||||||||||||||||||||
|---|---|---|---|---|---|---|---|---|---|---|---|---|---|---|---|---|---|---|---|---|---|
| protein | TYR38.A | TYR109.A | THR110.A | TRP125.A | LEU126.A | ASP129.A | ILE130.A | CYS133.A | ... | MET337.B | PRO338.B | ALA343.B | CYS344.B | LEU348.B | PHE351.B | ASP352.B | THR355.B | TYR359.B | |||
| interaction | Hydrophobic | Hydrophobic | Hydrophobic | Hydrophobic | Hydrophobic | Hydrophobic | HBDonor | Cationic | Hydrophobic | Hydrophobic | ... | Hydrophobic | Hydrophobic | Hydrophobic | Hydrophobic | Hydrophobic | Hydrophobic | PiStacking | Hydrophobic | Hydrophobic | Hydrophobic |
| Frame | |||||||||||||||||||||
| 0 | False | True | False | True | True | True | True | True | True | True | ... | True | True | False | False | False | True | False | True | True | True |
| 10 | False | True | False | True | True | True | True | True | True | True | ... | True | False | True | False | False | True | True | False | True | True |
| 20 | False | True | True | True | True | True | True | True | True | True | ... | True | False | True | False | False | True | False | False | False | True |
| 30 | True | True | True | True | True | True | True | True | True | True | ... | True | False | True | True | False | True | True | False | True | True |
| 40 | False | True | True | True | True | True | True | True | True | True | ... | False | False | False | False | False | True | True | True | False | True |
| 50 | True | True | False | False | True | True | True | True | True | True | ... | True | False | False | False | False | True | True | False | True | True |
| 60 | False | True | False | False | True | True | True | True | True | True | ... | False | False | False | False | False | True | False | True | True | True |
| 70 | False | True | False | True | True | True | True | True | True | True | ... | False | False | False | False | True | True | False | True | True | True |
| 80 | False | True | False | True | True | True | True | True | True | False | ... | True | False | False | False | True | True | False | True | True | True |
| 90 | True | False | False | True | False | True | True | True | True | True | ... | False | False | False | False | True | True | True | True | True | True |
10 rows × 40 columns
If the generated DataFrame is empty and you are using a PDB file, please manually call u.atoms.guess_bonds() right after creating the Universe with MDAnalysis, and rerun the code up to this point. This problem typically happens when the PDB file is missing all or some of the CONECT records to indicate bonds, which leads to structures with atoms but no bonds. By design, those structures cannot match any of the patterns that are used to define interactions, hence no interaction is
detected, resulting in an empty dataframe.
[6]:
# drop the ligand residue column since there's only a single ligand residue
df = df.droplevel("ligand", axis=1)
df.head(5)
[6]:
| protein | TYR38.A | TYR109.A | THR110.A | TRP125.A | LEU126.A | ASP129.A | ILE130.A | CYS133.A | ... | MET337.B | PRO338.B | ALA343.B | CYS344.B | LEU348.B | PHE351.B | ASP352.B | THR355.B | TYR359.B | |||
|---|---|---|---|---|---|---|---|---|---|---|---|---|---|---|---|---|---|---|---|---|---|
| interaction | Hydrophobic | Hydrophobic | Hydrophobic | Hydrophobic | Hydrophobic | Hydrophobic | HBDonor | Cationic | Hydrophobic | Hydrophobic | ... | Hydrophobic | Hydrophobic | Hydrophobic | Hydrophobic | Hydrophobic | Hydrophobic | PiStacking | Hydrophobic | Hydrophobic | Hydrophobic |
| Frame | |||||||||||||||||||||
| 0 | False | True | False | True | True | True | True | True | True | True | ... | True | True | False | False | False | True | False | True | True | True |
| 10 | False | True | False | True | True | True | True | True | True | True | ... | True | False | True | False | False | True | True | False | True | True |
| 20 | False | True | True | True | True | True | True | True | True | True | ... | True | False | True | False | False | True | False | False | False | True |
| 30 | True | True | True | True | True | True | True | True | True | True | ... | True | False | True | True | False | True | True | False | True | True |
| 40 | False | True | True | True | True | True | True | True | True | True | ... | False | False | False | False | False | True | True | True | False | True |
5 rows × 40 columns
[7]:
# show all pi-stacking interactions
df.xs("PiStacking", level="interaction", axis=1).head(5)
[7]:
| protein | PHE330.B | PHE331.B | PHE351.B |
|---|---|---|---|
| Frame | |||
| 0 | False | True | False |
| 10 | True | True | True |
| 20 | False | True | False |
| 30 | False | False | True |
| 40 | False | True | True |
[8]:
# show all interactions with a specific protein residue
df.xs("ASP129.A", level="protein", axis=1).head(5)
# or more simply
df["ASP129.A"].head(5)
[8]:
| interaction | Hydrophobic | HBDonor | Cationic |
|---|---|---|---|
| Frame | |||
| 0 | True | True | True |
| 10 | True | True | True |
| 20 | True | True | True |
| 30 | True | True | True |
| 40 | True | True | True |
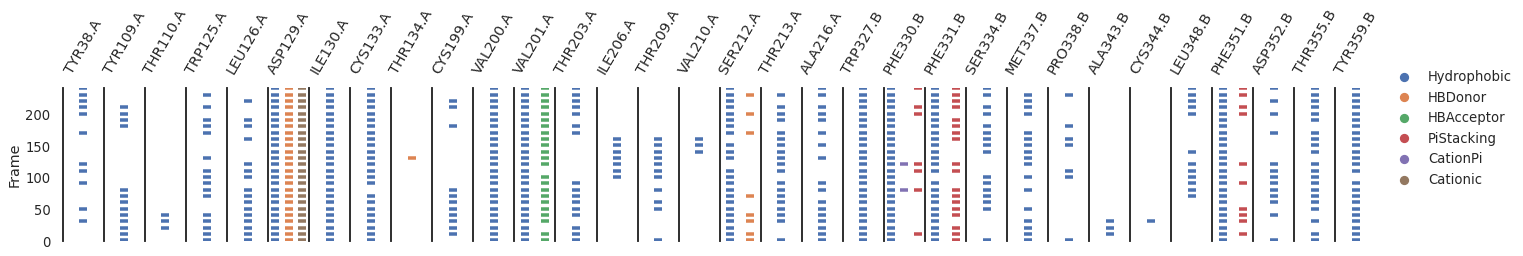
Here’s a simple example to plot the interactions over time
[9]:
import seaborn as sns
import pandas as pd

# reorganize data
data = df.reset_index()
data = pd.melt(data, id_vars=["Frame"], var_name=["residue","interaction"])
data = data[data["value"] != False]
data.reset_index(inplace=True, drop=True)

# plot
sns.set_theme(font_scale=.8, style="white", context="talk")
g = sns.catplot(
    data=data, x="interaction", y="Frame", hue="interaction", col="residue",
    hue_order=["Hydrophobic", "HBDonor", "HBAcceptor", "PiStacking", "CationPi", "Cationic"],
    height=3, aspect=0.2, jitter=0, sharex=False, marker="_", s=8, linewidth=3.5,
)
g.set_titles("{col_name}")
g.set(xticks=[], ylim=(-.5, data.Frame.max()+1))
g.set_xticklabels([])
g.set_xlabels("")
g.fig.subplots_adjust(wspace=0)
g.add_legend()
g.despine(bottom=True)
for ax in g.axes.flat:
    ax.invert_yaxis()
    ax.set_title(ax.get_title(), pad=15, rotation=60, ha="center", va="baseline")
/home/docs/checkouts/readthedocs.org/user_builds/prolif/conda/v0.3.4/lib/python3.9/site-packages/seaborn/categorical.py:1136: UserWarning: You passed a edgecolor/edgecolors ('#494949') for an unfilled marker ('_').  Matplotlib is ignoring the edgecolor in favor of the facecolor.  This behavior may change in the future.
  ax.scatter(cat_pos, strip_data, **kws)
/home/docs/checkouts/readthedocs.org/user_builds/prolif/conda/v0.3.4/lib/python3.9/site-packages/seaborn/axisgrid.py:64: UserWarning: Tight layout not applied. tight_layout cannot make axes width small enough to accommodate all axes decorations
  self.fig.tight_layout(*args, **kwargs)
[10]:
# calculate the occurence of each interaction on the trajectory
occ = df.mean()
# restrict to the frequent ones
occ.loc[occ > 0.3]
[10]:
protein   interaction
TYR38.A   Hydrophobic    0.44
TYR109.A  Hydrophobic    0.52
TRP125.A  Hydrophobic    0.64
LEU126.A  Hydrophobic    0.64
ASP129.A  Hydrophobic    1.00
          HBDonor        1.00
          Cationic       1.00
ILE130.A  Hydrophobic    1.00
CYS133.A  Hydrophobic    0.96
CYS199.A  Hydrophobic    0.44
VAL200.A  Hydrophobic    1.00
VAL201.A  Hydrophobic    1.00
          HBAcceptor     0.92
THR203.A  Hydrophobic    0.64
THR209.A  Hydrophobic    0.44
SER212.A  Hydrophobic    0.92
          HBDonor        0.32
THR213.A  Hydrophobic    0.76
ALA216.A  Hydrophobic    0.68
TRP327.B  Hydrophobic    1.00
PHE330.B  Hydrophobic    1.00
PHE331.B  Hydrophobic    0.96
          PiStacking     0.72
SER334.B  Hydrophobic    0.64
MET337.B  Hydrophobic    0.68
LEU348.B  Hydrophobic    0.48
PHE351.B  Hydrophobic    1.00
          PiStacking     0.40
ASP352.B  Hydrophobic    0.52
THR355.B  Hydrophobic    0.84
TYR359.B  Hydrophobic    0.96
dtype: float64
[11]:
# regroup all interactions together and do the same
g = (df.groupby(level=["protein"], axis=1)
       .sum()
       .astype(bool)
       .mean())
g.loc[g > 0.3]
[11]:
protein
ALA216.A    0.68
ASP129.A    1.00
ASP352.B    0.52
CYS133.A    0.96
CYS199.A    0.44
ILE130.A    1.00
LEU126.A    0.64
LEU348.B    0.48
MET337.B    0.68
PHE330.B    1.00
PHE331.B    0.96
PHE351.B    1.00
SER212.A    0.92
SER334.B    0.64
THR203.A    0.64
THR209.A    0.44
THR213.A    0.76
THR355.B    0.84
TRP125.A    0.64
TRP327.B    1.00
TYR109.A    0.52
TYR359.B    0.96
TYR38.A     0.44
VAL200.A    1.00
VAL201.A    1.00
dtype: float64
You can also compute a Tanimoto similarity between each frame:
[12]:
from rdkit import DataStructs
bvs = fp.to_bitvectors()
tanimoto_sims = DataStructs.BulkTanimotoSimilarity(bvs[0], bvs)
tanimoto_sims
[12]:
[1.0,
 0.71875,
 0.6451612903225806,
 0.6470588235294118,
 0.7419354838709677,
 0.7741935483870968,
 0.8275862068965517,
 0.8,
 0.78125,
 0.6774193548387096,
 0.6666666666666666,
 0.65625,
 0.5882352941176471,
 0.6333333333333333,
 0.6129032258064516,
 0.7,
 0.7,
 0.8275862068965517,
 0.7241379310344828,
 0.75,
 0.71875,
 0.696969696969697,
 0.6451612903225806,
 0.7741935483870968,
 0.625]